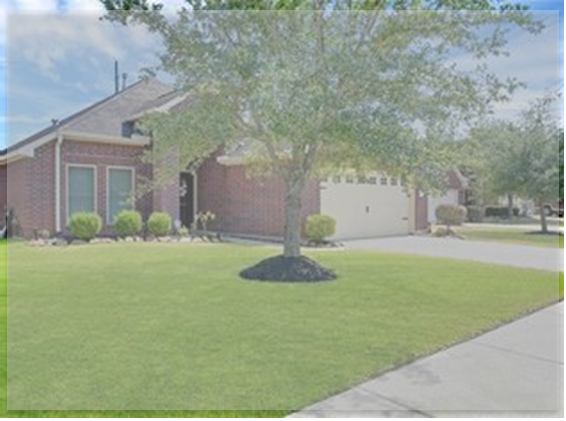
Houston – Spring, TX 77386 – Subject-to. $35k Below Market Value. Cashflow $745/mo After Expenses
Property Details
Year Built: 2011
Square Footage: 1,855
Bedroom Count: 3
Bathroom Count: 2
Garage: 2G
Pool: No Pool
Solar: No
HOA: $46/mo
Acquisition Details
Estimated Retail Value: $295,000
Purchase Price: $253,952
Seller Buyback Option: None
Lease Details
Lease Term: 24 months
Monthly Rent: $2,200
Tenant Monthly Payment: $1,700
Prepaid Rents: $12,000
Subject To Details
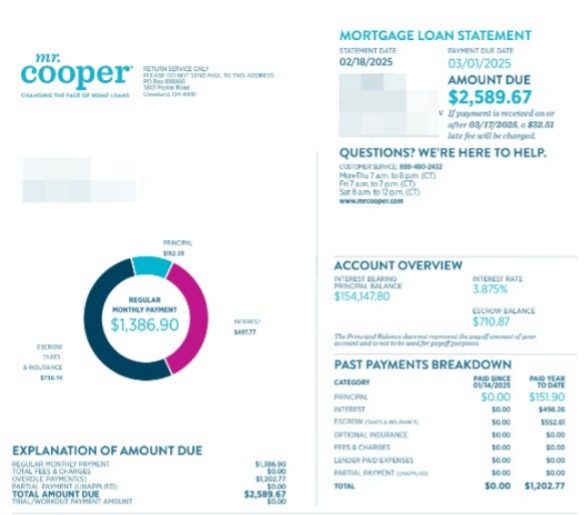
Mortgage Principal Balance: $154,147.80
Interest Rate: 3.875%
Monthly PITI: $1,203
Equity Needed To Purchase: $111,620
Includes: down-payment, some closing costs, and estimated repairs of approx $7000
This is a SUBJECT-TO property/investment – learn more about subject-to here.
| Property Specifications | 1 |
| Bedrooms | 3 |
| Bathrooms | 2 |
| Square Feet | 1855 |
| Year Built | 2011 |
| Garage Size | 2 |
| Schools Rating (scale 3-30, 30 is best) | 22 |
| Lot size (sq ft) | 5,897 |
| Purchase Assumptions | My Offer |
| Offer used for analysis | $253,952 |
| Suggested offer (low) | $255,000 |
| Suggested offer (high) | $255,000 |
| Asking | $253,952 |
| Market Value (after improvements) | $290,000 |
| Day-1 Equity | $36,048 |
| Estimated Improvements (lower) | $6,500 |
| Estimated Improvements (upper) | $7,500 |
| Estimated Closing Costs | $2,540 |
| Estimated Mortgage Costs | $0 |
| Other Fees At Closing (pts, . . . ) | $500 |
| Total Cost (estimated) | $263,992 |
| Financing Assumptions | |||
| Down Payment (%) | 40% | ||
| Down Payment Amount | $101,581 | ||
| Financed Amount | $152,371 | ||
| Interest Rate | 3.875% | ||
| Mortgage Term (Years) | 30 | ||
| Monthly Mortgage Payment | 32.6% | $717 | |
| Cash Outlay (Total Out of Pocket) | $111,620 | ||
| Estimated Financial Assumptions | Monthly | Yearly | |
| Rent (upper)* | $2,200 | $2,200 | $26,400 |
| Rent (lower)* | $2,200 | $26,400 | |
| * Can fluctuate depending on time of year property is being rented. | |||
| Property Taxes | $300 | $3,600 | |
| Insurance | $150 | $1,800 | |
| Repairs | 75 | $80 | $960 |
| Property Management Monthly (%) | 0.0% | ||
| Property Management Monthly ($) | $85 | $1,020 | |
| Leasing Fee | 100% | $91.7 | $1,100 |
| HOA or Fixed Costs | $46 | $552 | |
| Vacancy Rate | 4.0% | ||
| Total Fixed Expenses | 38.1% | $837 | $10,047 |
| Total Expenses (Fixed + Mortgage) | $1,554 | $18,645 | |
| |||||
| Years: | 5 | 10 | |||
| Cap Rate | 8.0% | 9.5% | |||
| Net Cash Flow | $44,671 | $105,605 | |||
| Equity Increase | $94,957 | $215,217 | |||
| Total Gain | $139,628 | $320,822 | |||
| Average Cash Flow/Year | $8,934 | $10,561 | |||
| Average Cash Flow/Month | $745 | $880 | |||
| Average Gain/Year | $27,926 | $32,082 | |||
| Average ROI | 125.1% | 287.4% | |||
| Annual ROI | 25.0% | 28.7% | |||
| Projected Property Value | $370,122 | $472,379 | |||